In this case WECC 9-bus test system [2], shown in Fig.1.1, is considered to perform the voltage stability monitoring of the system. This system contains 9 buses, 3 generators, 3 transformers and 6 transmission lines. In this case, it is assumed that PMUs are available at 3 generator terminals and one sensitive load bus, identified based on dQ/dV sensitivity analysis [3]. The case is simulated by increasing the load at the rate of 10% of base case per 20 sec. In this case stability monitoring is performed by using the two voltage stability indices, L-index [4] and VCPI [5] (brief description of the indices is presented below). The results were monitored by using the meters available in the runtime environment of the RTDS (Fig.1.2) and also by exporting the results at every operating point to external application (Fig.1.3). Both the indices reach to numerical value 1 as the system moves towards the stability limit. The results observed in Figs. 1.2 and 1.3, are matching with the results reported in [4] and [5].
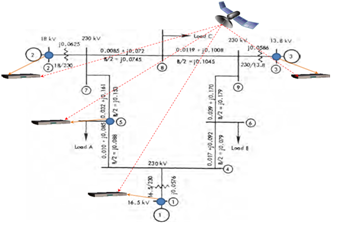
Fig. 1.1: WECC 9 bus test system
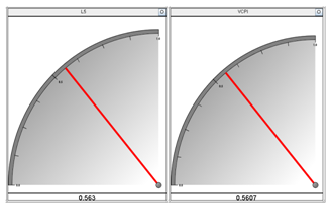
Fig. 1.2: L-index and VCPI at 140% above the base case in the RTDS run-time environment
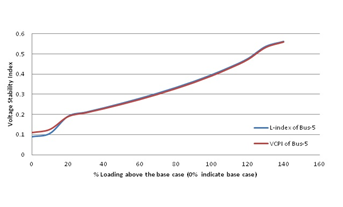
Fig. 1.3: Voltage stability indices monitored using external application
Huang et al. [3] have suggested dynamic L-index for online prediction of the voltage stability. The L-index can be computed at each load bus (say bus-j) using the following equation:
 (1)
(1) (2)
(2)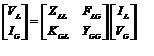 (3)
(3)Vi is the ith generator bus voltage, G is the set of all the generator buses, is the jith element of the FLG sub matrix of (3), VL, IL are the voltage and current vectors at the load buses, VG, IG are the voltage and current vectors at the generator buses.
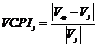
Voltage Collapse Proximity Index (VCPI) :Voltage Collapse Proximity Index (VCPI) suggested by Raghunatha et al [3], at a load bus-j, can be defined as:
 (4)
(4) (5)
(5)Vcg is the centroid voltage of the generator bus voltages, Vj is the jth bus phasor voltage, NG is the number of generators, Vk is the kth generator bus voltage phasor. Using the synchrophasor technology, if the PMUs are provided at various buses to measure voltages at a faster rate, the L-index and the VCPI can be computed in real time. Voltage collapse takes place when Lj and VCPIj reach numerical value of unity.
References:
[1] Ankush Sharma, Ch.V.V.S.Bhaskara Reddy, P. Banerjee, Bibhu P Padhy, S.C.Srivastava, and S. Chakrabarti,
“Synchrophasor based Power System Monitoring and Control using Real Time Digital Simulation Facility,”
National Power System Conference (NPSC), IIT (BHU) Varanasi, Dec. 2012.
[2] P. M. Anderson, and A. A. Fouad, Power System Control and Stability. Hoboken, NJ:John Wiley and sons,
2003.
[3] P. Kundur, Power System Stability and Control. NY:McGraw-Hill, 1994.
[4] Huang, G.M. and Nair, N.K.C., "Detection of dynamic voltage collapse," IEEE Power Engineering Society
Summer Meeting, 2002, vol.3 , July 2002, pp.1284-1289.
[5] R. Raghunatha, R. Ramanujam, K. Parthasarathy, and D. Thukaram, “A new and fast technique for voltage
stability analysis of a grid network using systm voltage space,” Int. J. Electr. Power Energy Syst., Vol.
20, No. 5, pp. 337-344, 1998.